Mass cytometry is a relatively new technology that like conventional flow cytometry facilitates multi-dimensional analysis at the single cell level. However, mass cytometry leverages the precision of mass spectrometry enabling the detection of over 40 cellular parameters simultaneously compared to roughly 18 parameters with conventional flow cytometry. This drastic increase in discernable parameters in a single sample significantly enhances the ability of cytometry to evaluate complex cellular systems and processes. Additionally, the higher dimensional analysis afforded by mass cytometry enables unbiased examination of intricate biological systems such as the immune system. At PicoImmune, our scientists have extensive experience with mass cytometry. We have helped numerous biopharmaceutical companies assess complex immune responses with our mass cytometry platform and progressed their drug discovery ventures.

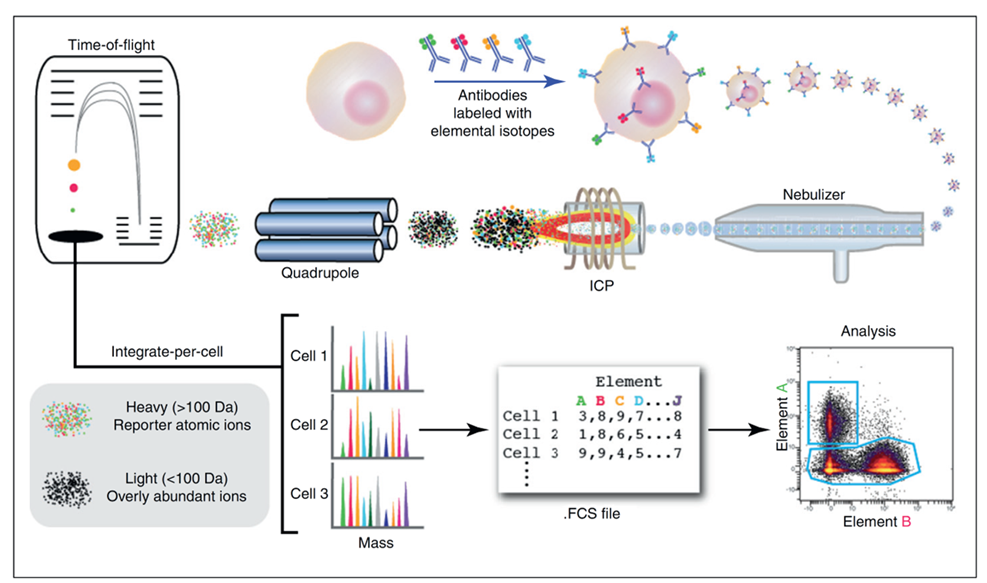
Principle of Mass Cytometry
Mechanistic diagram highlighting the principle of mass cytometry. Cells, stained with antibodies tagged with heavy metal isotopes, travel into the single cell introduction system and enter the ionization source (Inductively Coupled Plasma/ICP) one by one. Each cell is then atomized, ionized and overly abundant ions removed. After being ionized, the metal isotopes travel through a time of flight (TOF) analyzer, where they are separated based on their mass-to-charge ratio, forming a mass spectrum based on the target protein abundance with little overlap between parameters. Signals corresponding to each elemental tag are then correlated with the presence of the respective marker and analyzed using conventional cytometry platforms.
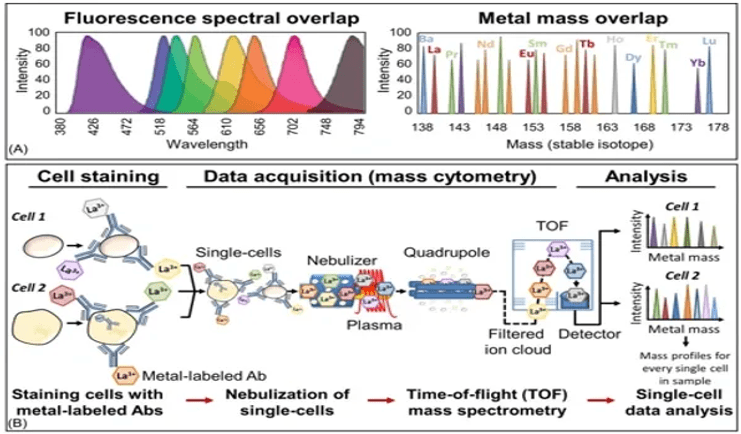
Advantages Over Conventional Flow Cytometry:
- Minimal spillover or spectral overlap
- No cell autofluorescence
- A larger variety of parameters/markers can be studied simultaneously in a single sample
- More data can be acquired from a single sample
- More complex and multi-dimensional datasets can be generated
Our Services Include:
- Cell treatment and processing (if needed)
- Cell staining with appropriate antibodies conjugated to metal isotopes
- Data analysis and interpretation
- Detailed report
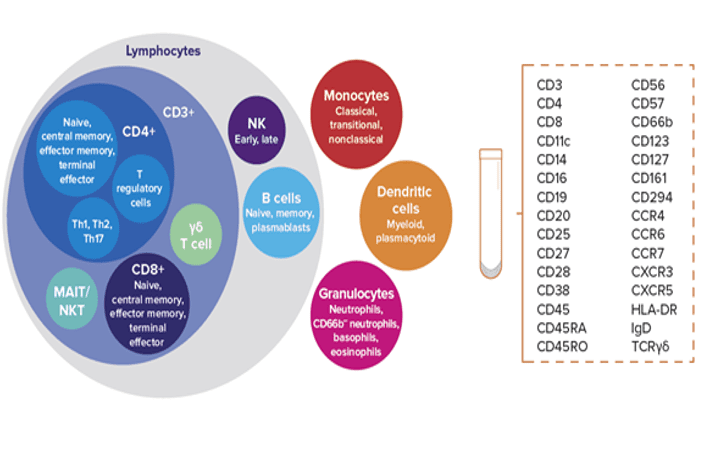
A comprehensive immune profile.
The 37 immune cell subsets (left) identified using the 30-marker base Maxpar Direct Immune Profiling Assay (right).
Example Data
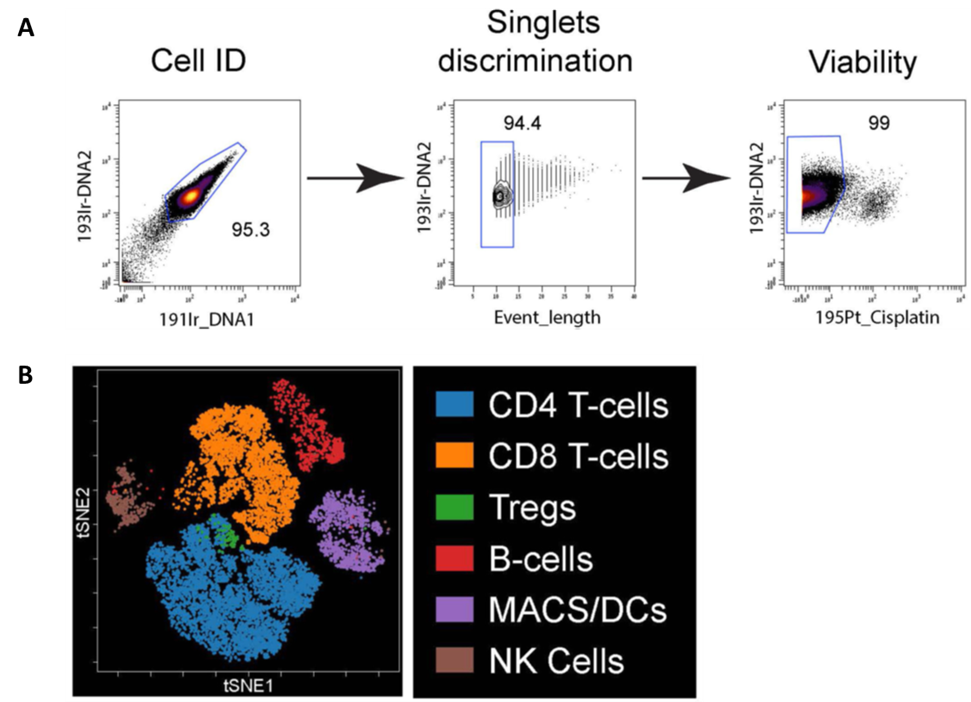
Mass Cytometry Data Analysis. (A) Cells are initially identified based on DNA staining followed by singlets based on event length, and then viability based on cisplatin exclusion. (B) Immune cell populations within a PBMC donor were plotted on bivariate viSNE plots. Main cell populations were manually gated based on lineage marker expression and then the manual gates were used as the overlaid (colored) dimension. The main cell populations are shown by the indicated color profile.
