PhosphoFlow Analysis

About PhosphoFlow

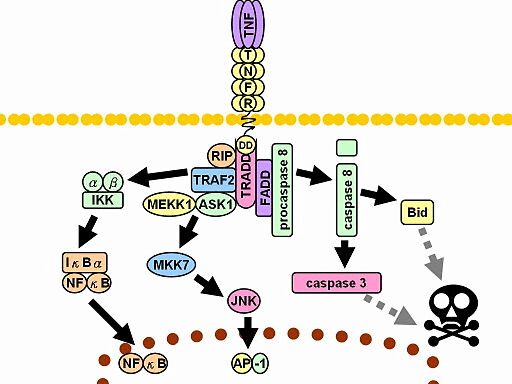
Many proteins involved in cellular signaling cascades are phosphorylated. Fluorescently-labeled antibodies specific to a variety of phosphorylated proteins facilitate the detection of these important proteins at the single cell level with flow cytometry. Additionally, this assay allows for the simultaneous examination of multiple phosphoproteins in distinct cell subsets in samples with multiple cell types. This assay is a more powerful and sensitive approach than traditional assays such as Western Blots which only highlights global protein status in samples that can contain heterogenous populations. 
phosphflow1

How Does the Assay Work?

Phosphoflow cytometric assays can specifically detect the state of protein phosphorylation at the cellular level. Our assays are optimized for multiple cell types including immune cells and whole bloods.

A general workflow is as follows:

  1. Treated and control cells or tissue/blood samples are processed and stained with viability dye and cell surface marker antibodies.
  2. The cells are fixed and permeabilized.
  3. The cells are then stained with the antibodies for intracellular phosphoproteins.
  4. The cells are acquired on a flow cytometer.

Sample Requirements:

  • Minuscule samples (minimal volume)
  • Compatibility with heterogeneous samples: works with a variety of sample types such as cultured cells, whole blood, PBMCs, isolated tissue cells (such as skin cells), etc.

Assay Benefits:

  • Superior specificity: delivers greater specificity than other common technologies like Western blot, potentially revealing heterogeneity in samples.
  • Flexibility: easily automated for use in routine compound screening
  • Simultaneous detection: detect multiple targets (phosphoproteins) and other markers in the same cell type or in distinct cell subsets in a heterogeneous cell sample.
  • Standardized platform: 96-well plate format using Cytoflex S flow cytometer.
  • Use of specialized reagents: Assay conditions are optimized for accurate and reproducible data.
  • Measure phosphorylation at a single cell
  • Provides data for mechanistic insights.

Service Features:

  • High throughput: 96-well format
  • Simultaneous quantitation: detect phosphoproteins in multiple cell populations in the same sample and/or multiple phosphoproteins in the same cell type
  • Highly reproducible
  • State-of-art platforms: Cytoflex S flow cytometer
  • Large inventory of phosphoprotein specific antibodies available
  • Extensive data analysis
  • Timely data delivery: 1-4 weeks or sooner, dependent upon receiving test samples
  • 20+ years of experience: Expert data analysis and interpretation, high quality scientific and technical support

Example Data
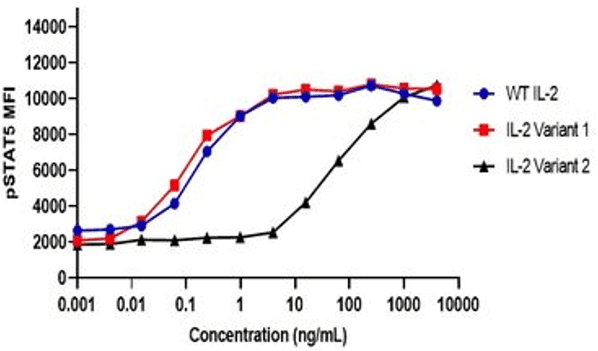
<strong> Example 1. </strong> The effect of IL-2 treatment on STAT5 phosphorylation in Tregs. Human PBMCs were treated with varying concentrations of wildtype (WT), Variant 1 or Variant 2 recombinant IL-2 for 2 h. The cells were then stained with appropriate fluorophore-conjugated antibodies and acquired on the Cytoflex S cytometer. The mean fluorescence intensity (MFI) of phosphorylated STAT5 (pSTAT5) was determined at each concentration.
Example 1. The effect of IL-2 treatment on STAT5 phosphorylation in Tregs. Human PBMCs were treated with varying concentrations of wildtype (WT), Variant 1 or Variant 2 recombinant IL-2 for 2 h. The cells were then stained with appropriate fluorophore-conjugated antibodies and acquired on the Cytoflex S cytometer. The mean fluorescence intensity (MFI) of phosphorylated STAT5 (pSTAT5) was determined at each concentration.
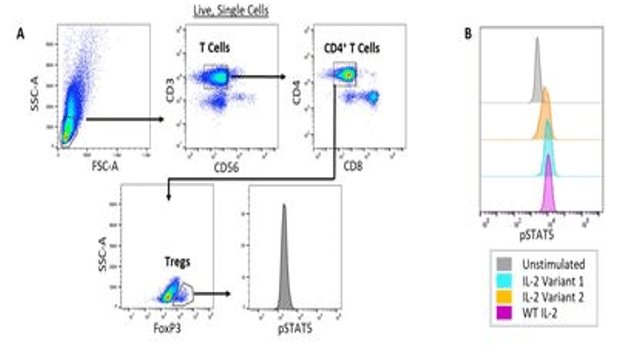
<strong> Example 2</strong> Multidimensional analyses with phospho-specific flow cytometry. (A) Gating strategy to identify Tregs and examine STAT5 phosphorylation in a human PBMC sample. Human PBMCs were treated with 60 ng/mL of wildtype (WT), Variant 1 or Variant 2 recombinant IL-2. The cells were then stained with fluorescently-conjugated antibodies against CD3, CD56, CD4, CD8, FoxP3 and phosphorylated STAT5 (pSTAT5). (B) The level of STAT5 phosphorylation in Tregs in response to a fixed concentration of different IL-2 variants was analyzed.
Example 2 Multidimensional analyses with phospho-specific flow cytometry. (A) Gating strategy to identify Tregs and examine STAT5 phosphorylation in a human PBMC sample. Human PBMCs were treated with 60 ng/mL of wildtype (WT), Variant 1 or Variant 2 recombinant IL-2. The cells were then stained with fluorescently-conjugated antibodies against CD3, CD56, CD4, CD8, FoxP3 and phosphorylated STAT5 (pSTAT5). (B) The level of STAT5 phosphorylation in Tregs in response to a fixed concentration of different IL-2 variants was analyzed.
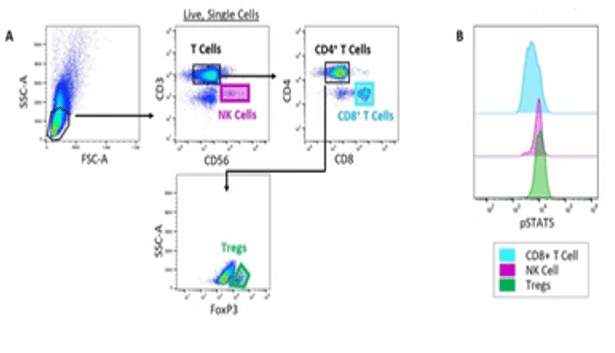
<strong>Example 3. </strong> Evaluation of pSTAT5 in multiple cell subsets following IL-2 treatment. (A) Gating strategy to identify Natural Killer (NK) cells, CD8+ T cells and Tregs in a PBMC sample. Normal human PBMCs were treated with 60 ng/mL of wildtype (WT) recombinant IL-2. The cells were then stained with fluorescently-conjugated antibodies against CD3, CD56, CD4, CD8, FoxP3 and phosphorylated STAT5 (pSTAT5). (B) The level of STAT5 phosphorylation in Natural Killer (NK) cells, CD8+ T cells and Tregs in response to WT IL-2 was analyzed.
Example 3. Evaluation of pSTAT5 in multiple cell subsets following IL-2 treatment. (A) Gating strategy to identify Natural Killer (NK) cells, CD8+ T cells and Tregs in a PBMC sample. Normal human PBMCs were treated with 60 ng/mL of wildtype (WT) recombinant IL-2. The cells were then stained with fluorescently-conjugated antibodies against CD3, CD56, CD4, CD8, FoxP3 and phosphorylated STAT5 (pSTAT5). (B) The level of STAT5 phosphorylation in Natural Killer (NK) cells, CD8+ T cells and Tregs in response to WT IL-2 was analyzed.